Creating Reports
Last updated: June 23, 2026
Reports turn the data on your Issues Board into CSV exports you can drop straight into a spreadsheet, a BI tool, or an executive review deck.
Which report do I need?
There are two types. Pick based on what you're trying to do:
Issues report — one row per finding. Choose this when you need detail: importing into a ticketing system, handing a worklist to a team, or producing per-finding evidence for an audit.
Metrics report — a single summary row of KPIs. Choose this when you need the headline numbers: a leadership update or an SLA review.
Not sure where to start? Most teams begin with the monthly executive summary below — a Metrics report over the last 30 days is the quickest way to a shareable snapshot.
Create a report
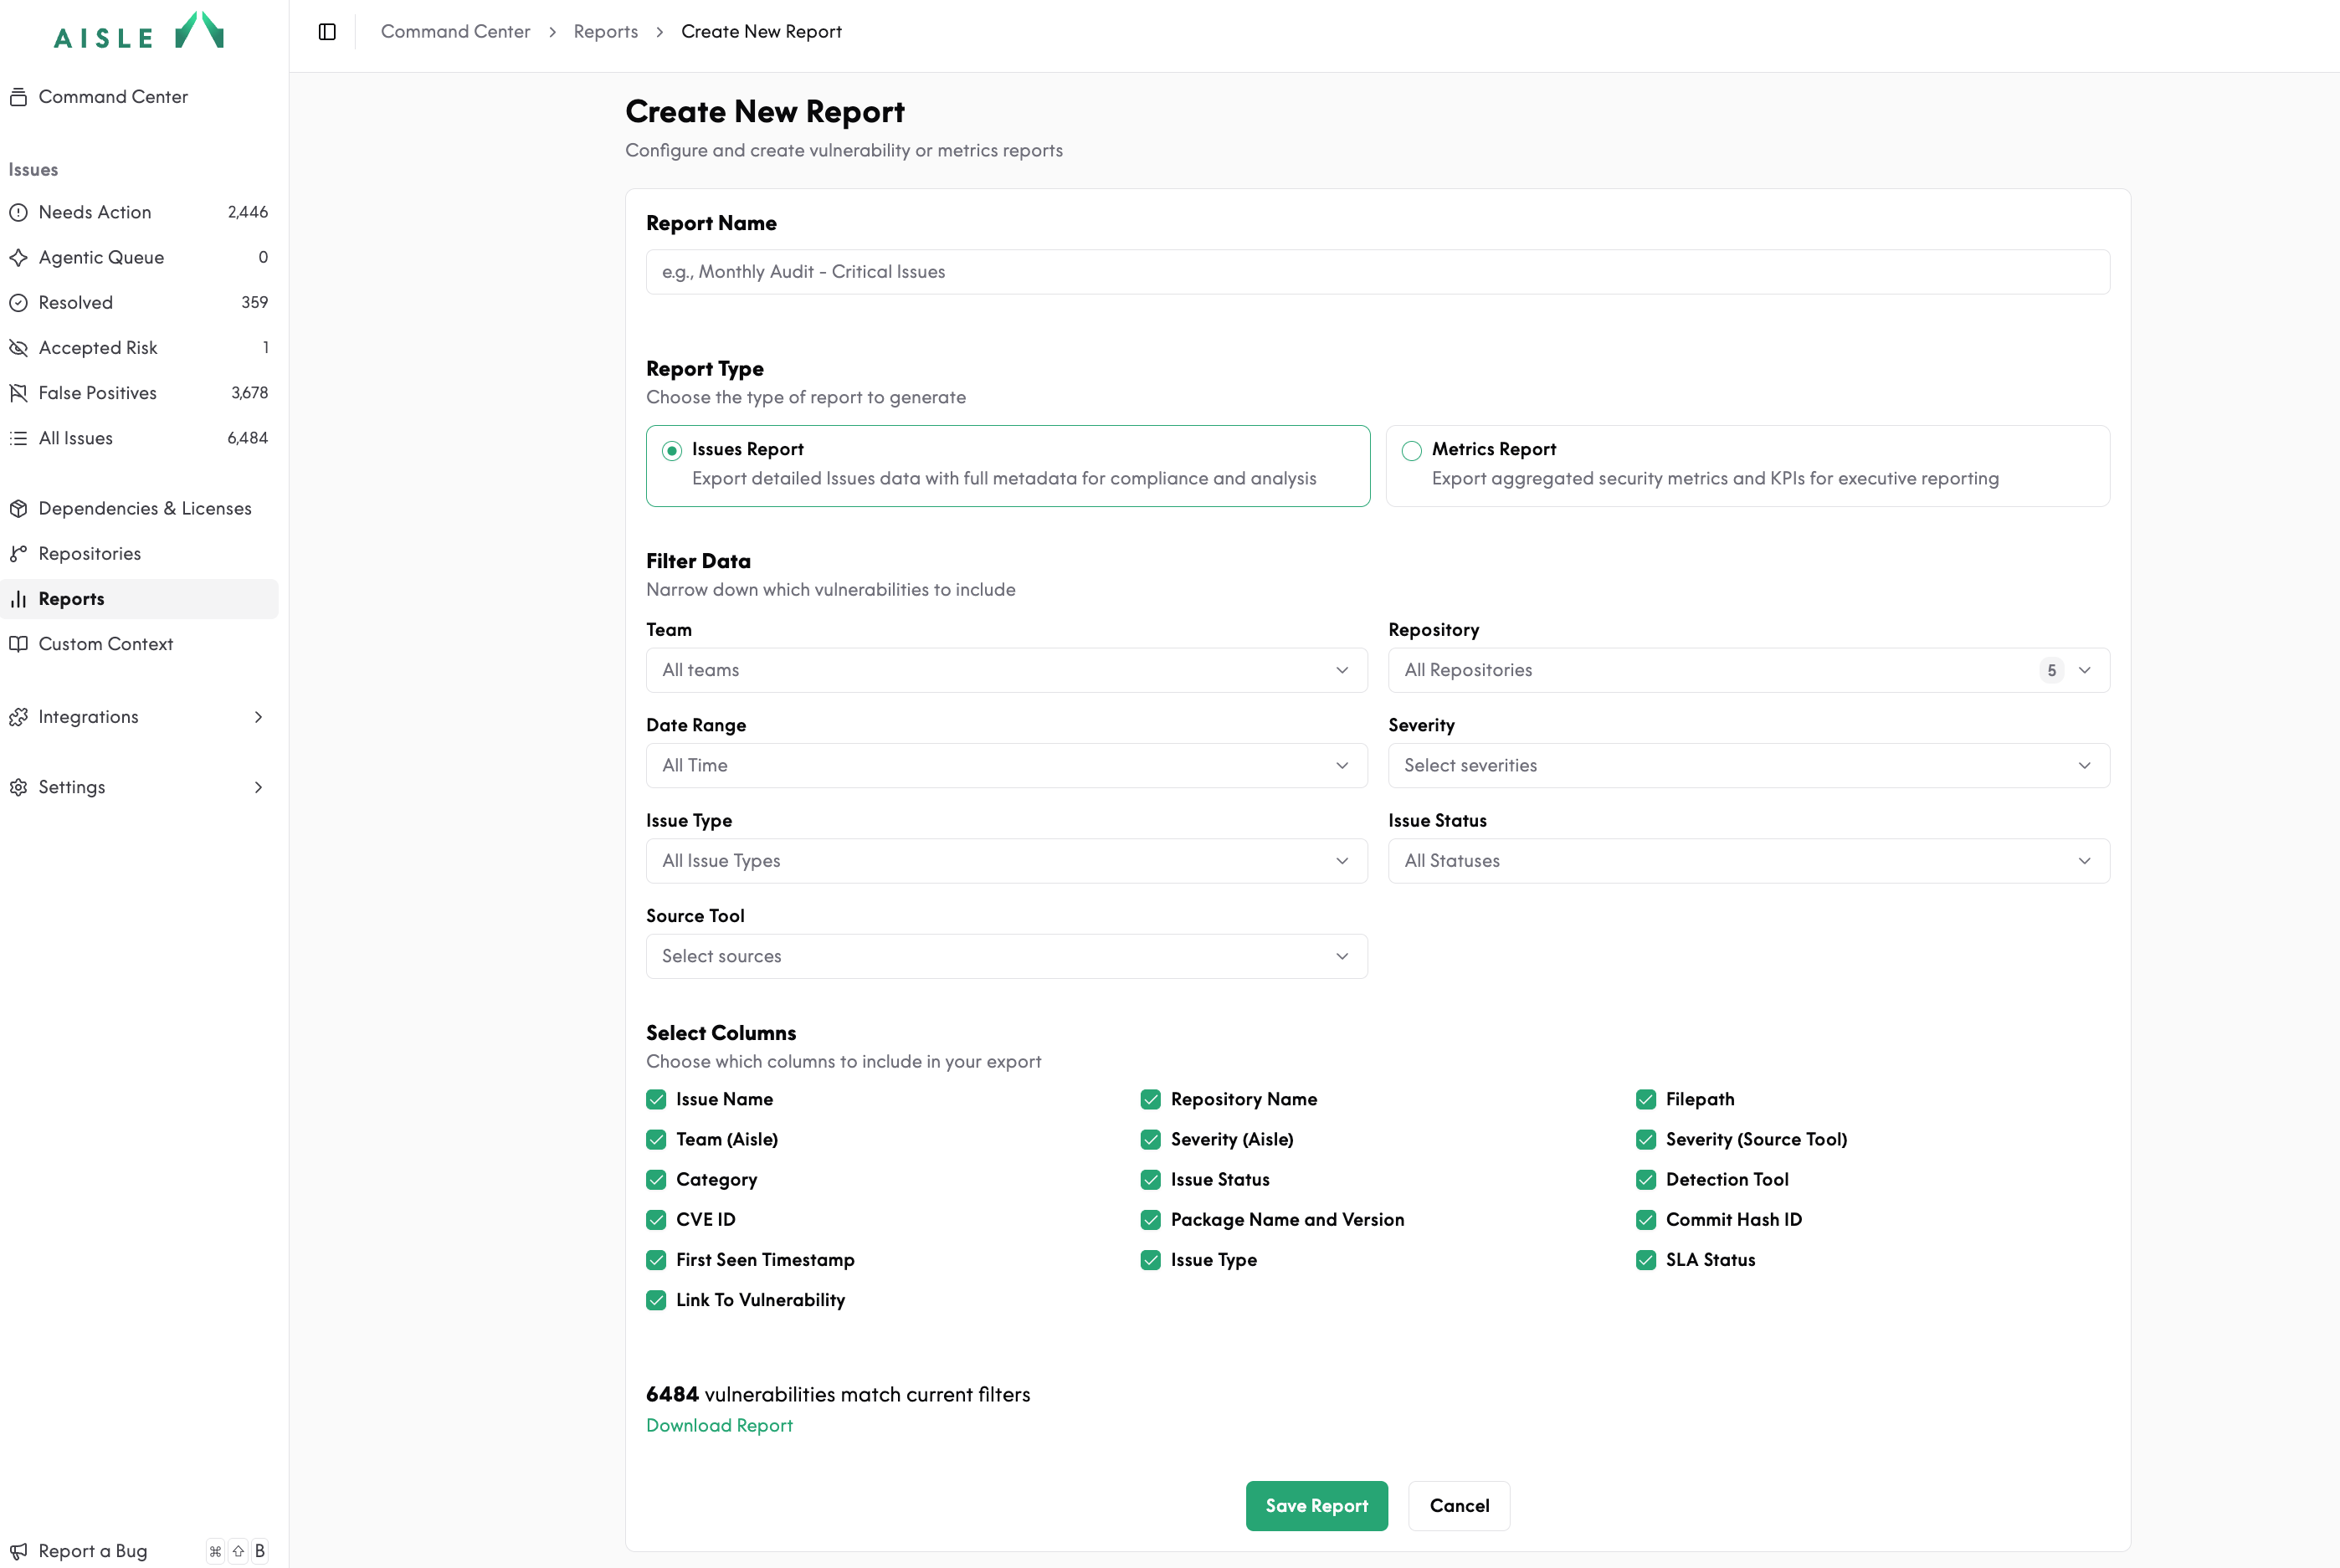
Open Reports in the left sidebar, select Create New Report, then: name it, choose the type, set your filters, and tick the columns you want. From the Reports list you can also Download, Edit, or delete any report you've saved.
Common reports
These four cover most needs. Each is just a type plus a few filters:
Weekly triage list — Issues report · last 7 days · status
needs_action· severity Critical and High. The short list of what needs attention now.Monthly executive summary — Metrics report · last 30 days · no other filters. One row of headline KPIs for a leadership update.
SLA / audit evidence — Issues report · custom date range · source tool set to your intake. A timestamped, per-finding record for compliance.
License review — Issues report · issue type
license· all statuses. Every dependency-license finding in one export.
Filters
Both report types share the same filters:
Filter | Notes |
|---|---|
Team | Single or multi-select. |
Repository | Select up to 1,000 repositories. |
Date Range | All Time, a preset of the last 1 / 7 / 14 / 30 / 90 days, or a custom range. |
Severity | Critical, High, Medium, Low. |
Issue Type |
|
Issue Status | Any combination of the lifecycle statuses. |
Source Tool | Issues report only — narrow the export to a single detection tool. |
Format and saving
Reports download as CSV files named {report_name}_{timestamp}.csv — open the CSV in the tool of your choice to format it. (There's no native PDF or Excel export.)
A saved report is a configuration: the filters and columns you chose. Running it (Download) generates a fresh CSV against your current data every time, so you can keep many configurations side by side — one per team, one for the board pack, one for the SLA review.
Reference: columns
Issues report
One row per finding, with: Issue Name · Repository Name · Filepath · Team (Aisle) · Severity (Aisle) · Severity (Source Tool) · Category · Issue Status · Detection Tool · CVE ID · Package Name and Version · Commit Hash ID · First Seen Timestamp · Issue Type · SLA Status · Link To Vulnerability.
Metrics report
A single summary row:
Column | What it measures |
|---|---|
Total Vulnerabilities Detected | Findings detected in the selected range. |
Total Resolved | Findings resolved in the range. |
Resolution Rate (%) | Resolved as a share of detected. |
MTTR Manual / Consultant / Collaborative (hours) | Mean time to resolve a finding, split by how it was fixed: by your team, with Aisle support, or collaboratively using Aisle's fix suggestions. |
Average Triage Time (hours) | Average time from a finding appearing to a triage decision. |
Noise Reduction Rate (%) | Share of raw findings filtered out as noise before reaching your team. |
Coverage Rate (%) | Share of your repositories that have been analyzed. |
Average Time to Create Fix & Verify (hours) | Average time to produce a fix suggestion and verify it. |
For more on the underlying data, see Understanding Issue Details and Adjusting SLAs.